Facts:
-currently not profitable
-increasing R&D Investments
-increasing Team and Ressource consumption
-Trend of increasingly improving EPS (Earnings Per Share)

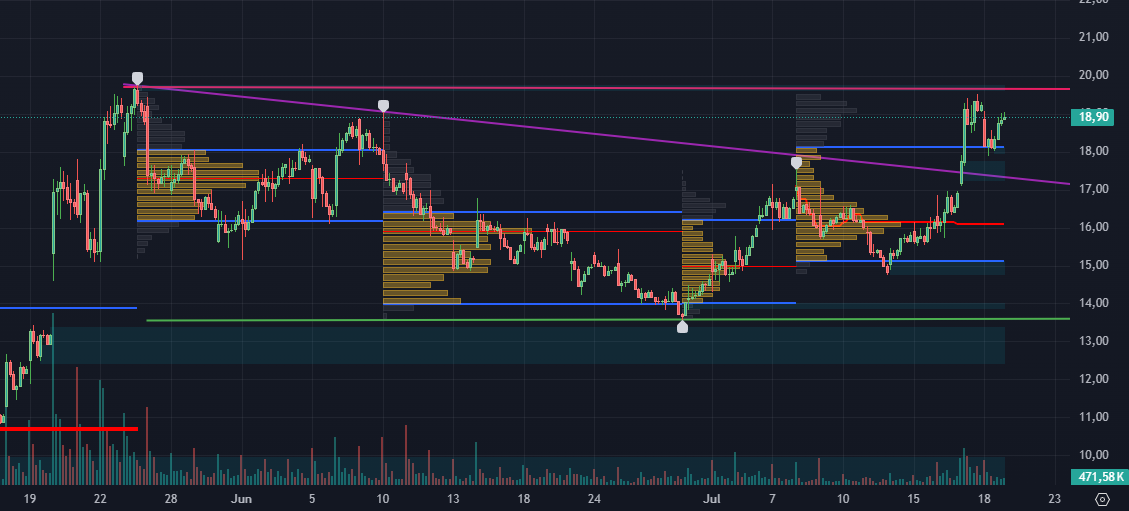
The 1 hour chart shows a consolidation in the last 59 days.
Price range: 13,8 – 19,6$
The slight downward trend was broken on July 17th.
Analysts price the stock at 16$, so at the moment it is overpriced by 2,83$.

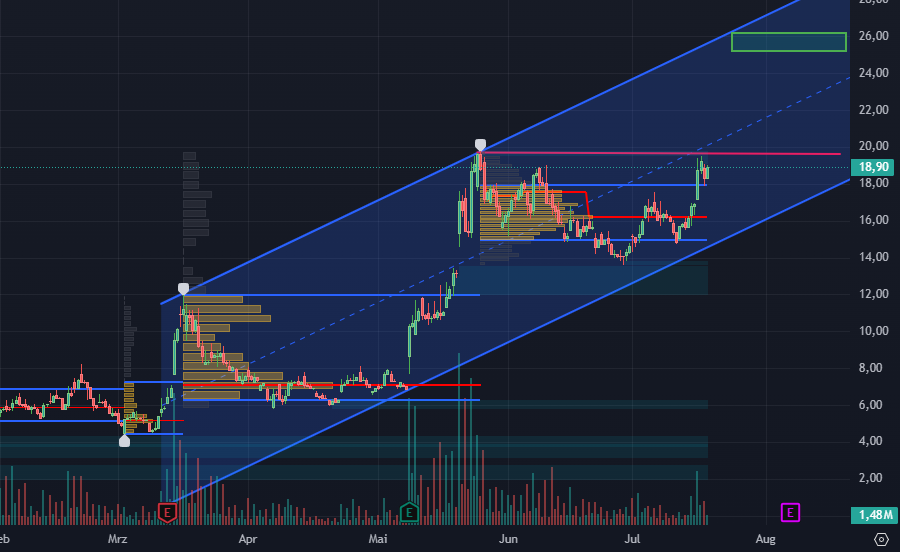
The 4 hour chart indicates a soon swing upwards.
The chart shows a periodic movement upwoards with gaining volume.
The period is about 66days, which is due on the 28th July.
Buy – strong Buy recommendation by independent analysts (https://www.quiverquant.com/stock/QBTS/forecastyahoo finance).
Careful: Own Opinion
I agree with that recommendation,
Despite my belief in a short-term gain to about 25$. I rather think of it as a long-term chance.
D-WAVE is confident that its cash balance ($300 million ), is enough to reach profitability.
With the current developments, I believe that to be in a couple of years (approximatly 2027).
Combined with the increasing R&D expenditure of D-Wave.
I see a good hold till profitability.

Leave a Reply